San Francisco Residential Market Data Resource · Updated May 2026

San Francisco Real Estate
in the AI Era

A data-driven look at how the AI boom is reshaping the San Francisco housing market. The city is in one of its strongest spring markets in years, with demand surging and inventory down sharply. But the heat is concentrated, strongest in single-family homes and the cash-paying luxury tier, and notably softer in the high-rise condos closest to the new AI offices. Every figure here is drawn from the San Francisco Multiple Listing Service.

All trend data covers 2016 to present. We do not claim records before 2016, only what our data can support.
124.6%
Single-family sale-to-list price in May 2026
−38%
Active listings vs a year ago, all property types
65%
Of single-family buyers used financing in May
$2.2M
Single-family median price, May 2026
12
Median days on market for single-family
The market by property type

A rolling 12-month view

A rolling 12-month window (June 2025–May 2026) measured against the prior 12 months (June 2024–May 2025). Using a full year on each side smooths out seasonal swings and gives a steadier read of where each property type stands. Single family is the engine; the other types are firming rather than frothing.

Property typeMedian price (year over year)Median $/SqFtDays on marketSale vs list% over listFinanced
Single Family$1.77M (+9.4%)$1,01713114%80%75%
Condo / Townhouse$1.17M (+5.9%)$99726100%43%67%
Tenancy in Common$1.06M (−4.1%)$86637100%50%78%
Multi-Unit (2–4+)$2.0M (+6.7%)$53931100%43%74%
In May, single-family homes sold at 124.6% of list price with 86% closing over asking, the median crossed $2.2M, and for every active listing there was nearly one already in contract.
May 2026 month-to-date: 185 single-family and 184 condo / townhouse closings. Roughly 290 active listings and 290 already pending means nearly everything that comes on market is going under contract, a fast-clearing, supply-constrained market rather than a demand-driven bubble.
Price segments

The same dollar buys a different market

Break each property type into price bands and the behavior diverges sharply. Single-family competition peaks in the move-up middle ($1.5M–3M), not at the entry or the top. Condos run cooler at every band. Most buyers use financing across nearly every segment, though the financed share drops at the very top of the market. Trailing twelve months of closed sales.

% selling over asking, by price band

Single family vs condo / townhouse

Financed buyers, by price band

Most buyers use financing; share drops at the top
Price bandTypeClosedSale/list% overDaysFinanced

How to read it: at $1.0–1.5M a single-family home sells over asking 82% of the time in about 14 days; a condo at the same price does so just 50% of the time and takes about 21 days. Same dollar amount, very different competitive reality. Entry-level condos (under $1M) are the softest segment in the city, 45 days on market and only 27% over asking, the same SoMa / downtown weakness seen in the district view.

Neighborhood detail

The district breakdown

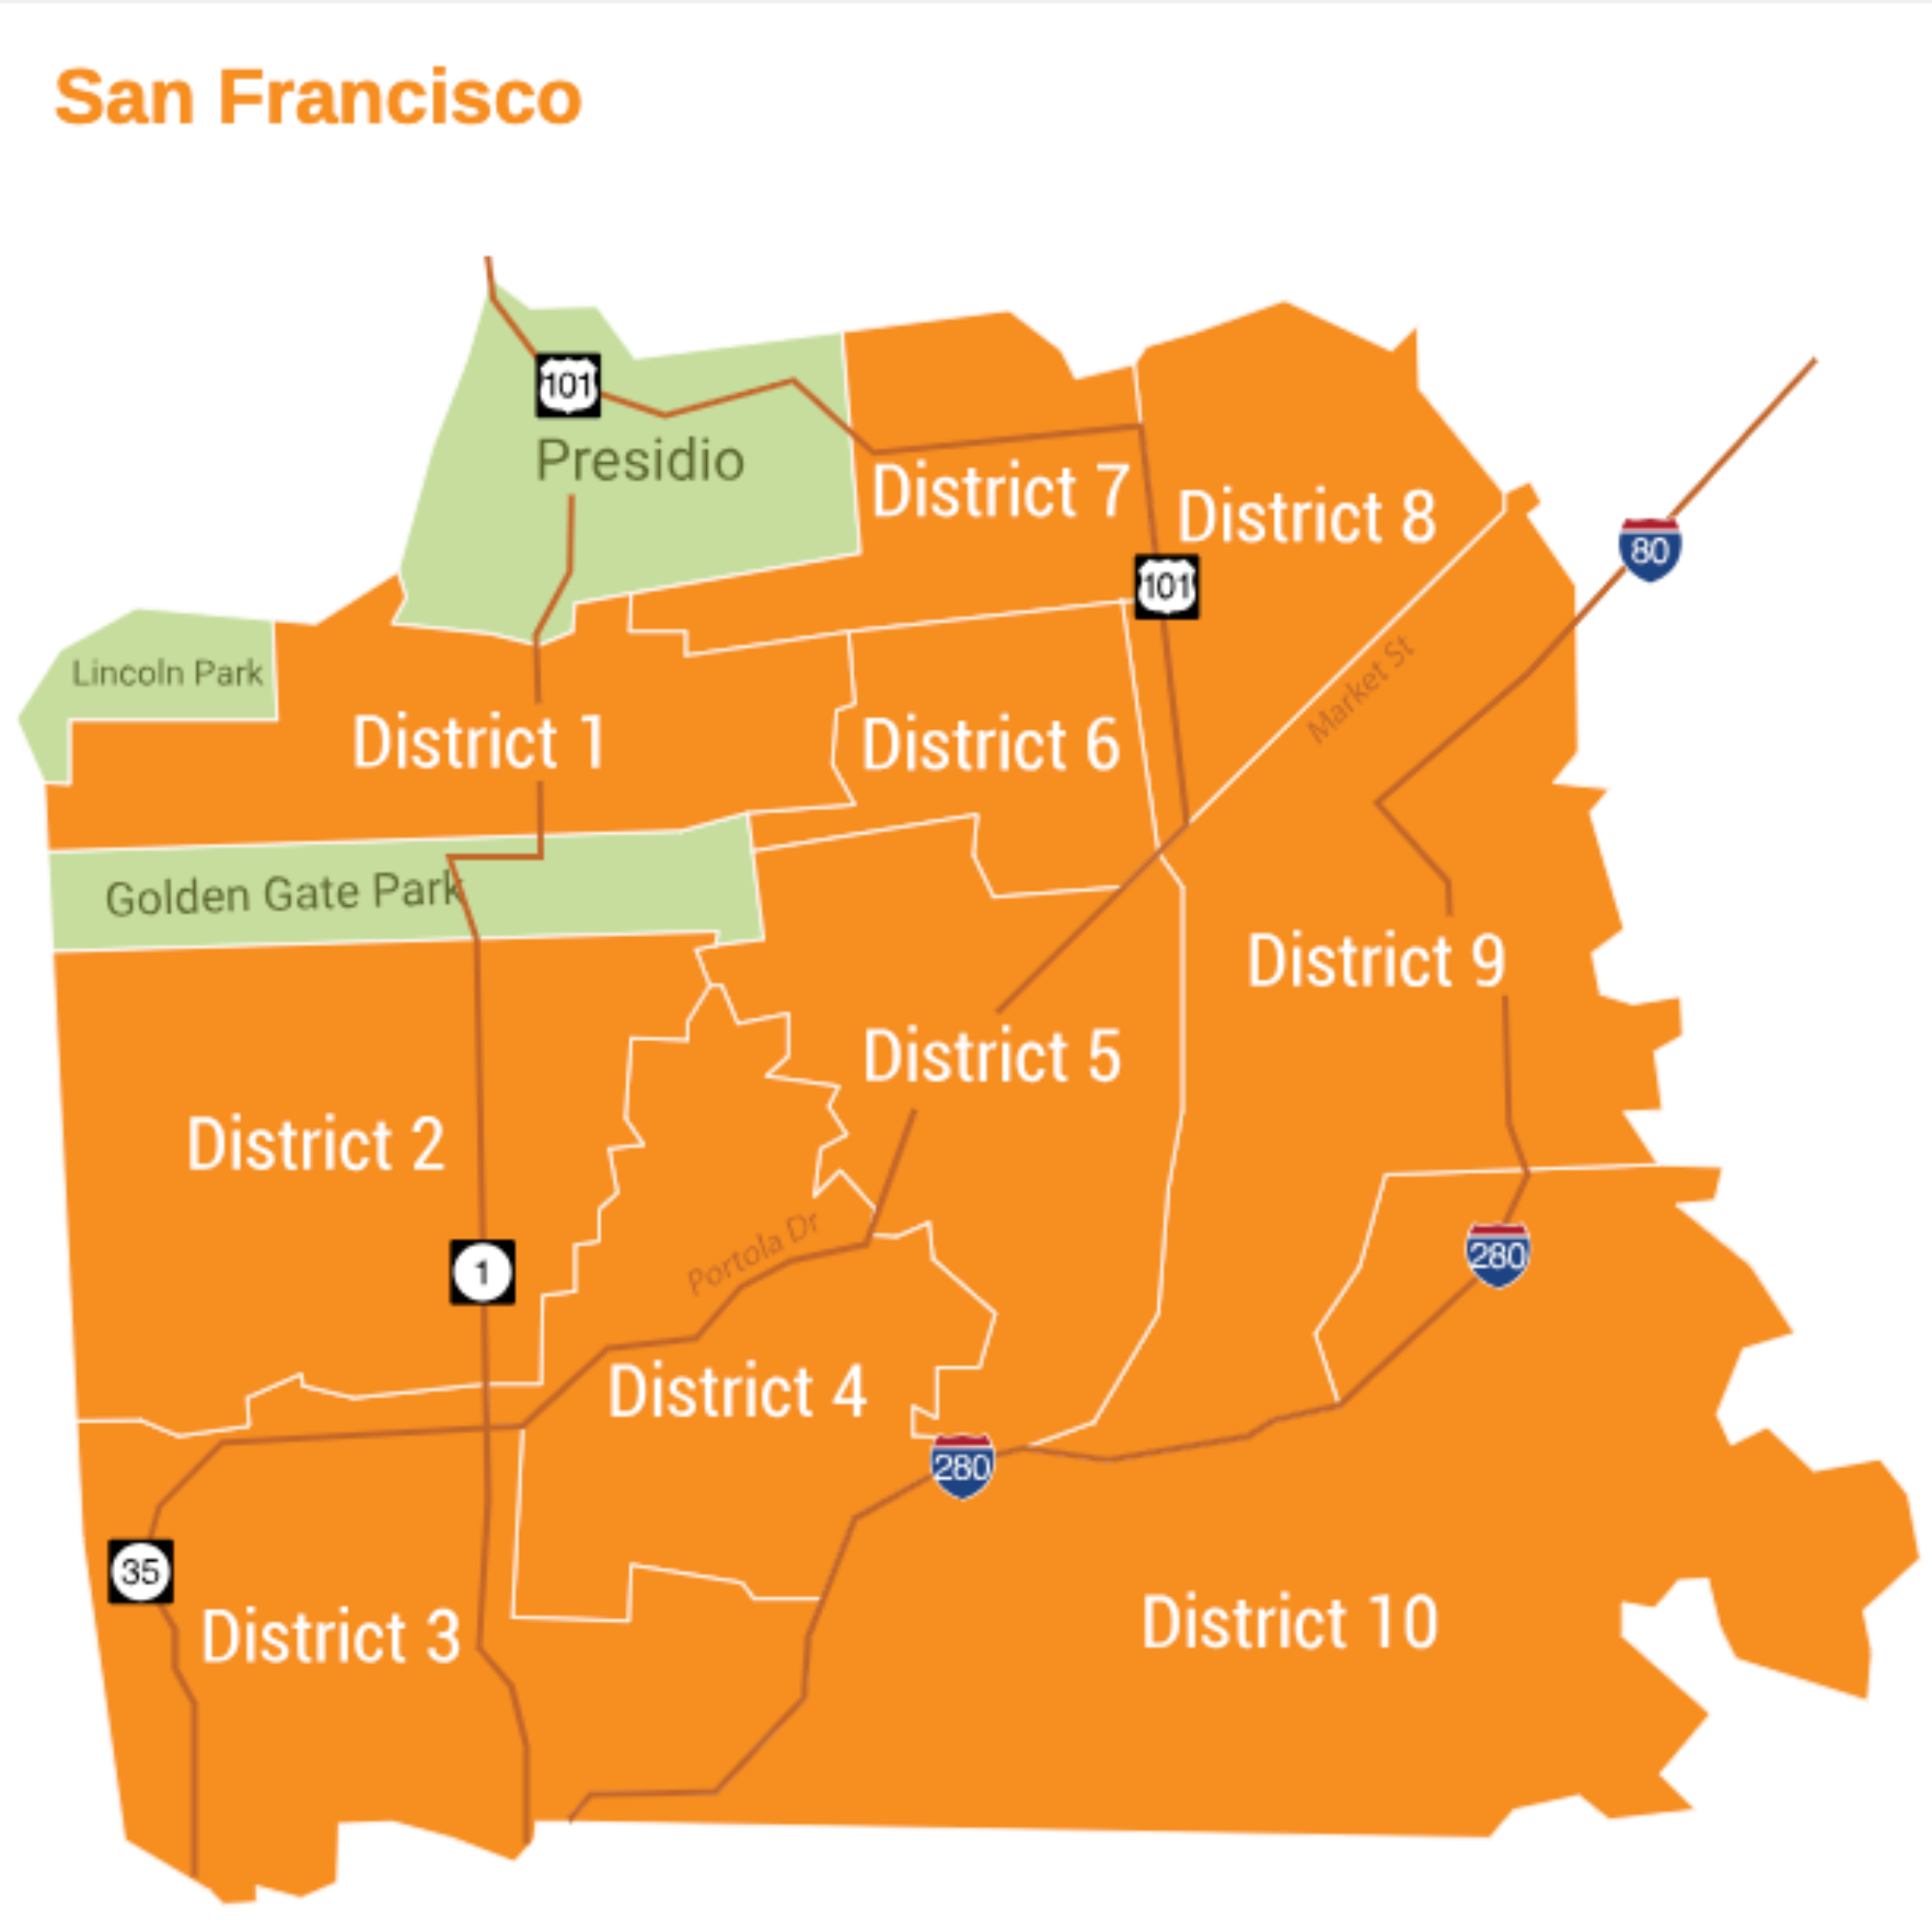
Where the competition actually lives. The San Francisco Multiple Listing Service breaks the city into 10 districts; the labels below show the main neighborhoods each one covers. Figures are the January–April window for 2026, measured against each district's own 11-year peak. Toggle between single family and condo to see how differently the two markets are behaving.

Browse all 89 neighborhoods →

Single family: % selling over asking

2026 vs each district's 11-year peak
DistrictMedian$/SqFtSale/list% overPeak (yr)
The top of the market

The luxury surge

Luxury, defined as $5M+ single-family homes and $3M+ condos (roughly the top 5% of sales), is where AI-era wealth shows up most clearly. At the top, most deals skip the lender.

May 2026 luxury tier

$5M+ Single Family$7.95M median · 10 days
$5M+ — used financing36%
$3M+ Condo$4.23M median · 11 days
$3M+ — used financing42%
~1/3 financed vs ~2/3 citywideUltra-prime: ~1.5 weeks

What the luxury data shows

  • Financing flips at the top. Only about a third of luxury buyers use financing, versus two-thirds market-wide. High-end deals lean less on lender approval, the clearest sign of new AI-era wealth.
  • Record month. April 2026 had the most $5M+ home sales of any month in our records (since 2016), surpassing the 2021 peak.
  • Speed at the top. Several recent sales topped $10M within 9–10 days; one closed at nearly 190% of list price.
The honest nuance

The AI corridor gap

Here is the most interesting story in the data, and the one most market commentary misses. The capital is real, but it is not lifting everything evenly.

Where it isn't hot

  • The softest condo markets in the city are SoMa, Mission Bay, and downtown, the very neighborhoods nearest the new AI offices. There, only about 37–43% of condos sell over asking, well below past peaks.
  • The capital is leasing the office towers (3.4M sq ft signed in Q1 2026, led by AI firms) but has not yet flowed back into the high-rise condos beside them.
  • Tech employment actually declined in 2025 even as AI investment surged, so today's demand is driven more by capital and equity than by broad hiring.

Condo competition by district

% selling over asking — the AI-office districts sit at the bottom

The takeaway for buyers and sellers: a genuinely strong market led by single family and luxury, with real opportunity remaining in the condo segment near the AI corridor. The open question for the next two years is whether AI capital broadens into jobs and household formation, which is what would make the cycle durable.

What it means for you

Reading the data as a buyer or a seller

Numbers are only useful if they change what you do. Here is how this market translates into strategy on each side of the table.

If you are buying

  • Expect to compete for single family, especially $1.5M–3M. Roughly 86–89% sell over asking in that band, so come in clean, fully underwritten, and ready to move in about two weeks.
  • Look where it is softer. Condos, and especially SoMa, Mission Bay, and downtown, have far less competition and real negotiating room, plus upside if AI jobs follow the capital.
  • Your playbook depends on your segment, not the headline. An entry-level condo and a move-up house are two different markets at the same price.
  • Set a walk-away number first. A strong market is a reason to be more disciplined, not less. The right home at the wrong price is still the wrong deal.
  • If you need financing, that's the norm. About two-thirds of San Francisco buyers do. A clean, well-prepared financed offer remains highly competitive.

If you are selling

  • Single-family leverage is real. With inventory down about 38% and May homes closing near 124% of list, a well-prepared, well-priced home can draw multiple strong offers quickly.
  • Preparation still earns the premium. The overbids go to move-in-ready, correctly priced homes, not to anyone who simply lists. Prep and pricing still decide the outcome.
  • Condo sellers, price to the real market. Condos sit longer than houses, and downtown and SoMa are softer, so single-family assumptions will cost you. Price to today, not to the headline.
  • Most offers come financed. Roughly two-thirds of buyers use a mortgage, with cash a meaningful minority (more common at the top). Both can win; the right offer depends on contingencies and timing.

The one rule for both sides: in San Francisco, the asset still matters. Two homes five blocks apart can carry very different risk. The headline tells you the weather; the specific property, financing, and block tell you what to actually do.

Curious what this means for your block?

Whether you are weighing a move or just want to understand where your neighborhood actually stands, I am happy to talk it through. No pressure, just a clear, honest read on the market.

Email Paulo Call (408) 834-9161 Follow @sfrealtorPaulo Download the 1-page brief (PDF)
Paulo Serna
Real Estate Agent · Level Up Group at Compass · CalDRE #02150409
(408) 834-9161  ·  paulo@levelupgroup.com  ·  instagram.com/sfrealtorPaulo